
Table with Heading
| Board | CBSE |
| Textbook | Code 417 |
| Class | 10 |
| Chapter | 1 |
| Chapter Name | AI Project Cycle and Ethical Framework |
| Subject | Artificial Intelligence 417 |
AI Project Cycle and Ethical Frameworks Complete PDF Notes
AI Project Cycle and Ethical Frameworks Lecture
Project Cycle Overview
As we have already coverd the whole project cycle previously in the past sessions, we will just a quick overview of the whole process through the example of “making a birthday card for your mother”.
- Problem Scoping: First, you define the objective of the project—creating a meaningful greeting card for your mother. To understand what kind of card would be suitable, you explore various greeting card ideas by browsing online resources, watching videos, or seeking suggestions from someone experienced in card making.
- Data Acquisition: After finalizing the design idea, you identify and list all the materials required to create the greeting card, such as paper, colors, decorative items, and tools.
- Data Exploration: Next, you review the available resources by checking which materials you already have and identifying what is missing. Based on this analysis, you gather or purchase the remaining items needed for the project.
- Modelling: With all the materials ready, you begin the actual creation of the greeting card by implementing the chosen design and assembling the elements accordingly.
- Evaluation: During or after the creation process, you evaluate the card. If you notice an error that cannot be corrected, you discard the faulty version and remake the card to ensure it meets the desired quality.
- Deployment: Once the greeting card is successfully completed and meets the expected outcome, you deliver the final product by gifting it to your mother.
AI Project Cycle Flowchart

What is the AI Project Cycle?
The AI Project Cycle is a step-by-step process used to build AI-based solutions. It consists of six stages:
- Problem Scoping – Defining the problem and setting goals
- Data Acquisition – Collecting relevant data
- Data Exploration – Analysing and visualizing data
- Modelling – Selecting and training AI models
- Evaluation – Testing model performance
- Deployment – Implementing the AI solution in real life
This cycle helps developers design efficient, accurate, and ethical AI systems.
Intro to AI Domains
Artificial Intelligence becomes intelligent based on the training it receives.
For training, the machine is fed with datasets. According to the applications for which the AI algorithm is being developed, the data fed into it changes.
With respect to the type of data fed in the AI model, AI models can be broadly categorized into three domains:
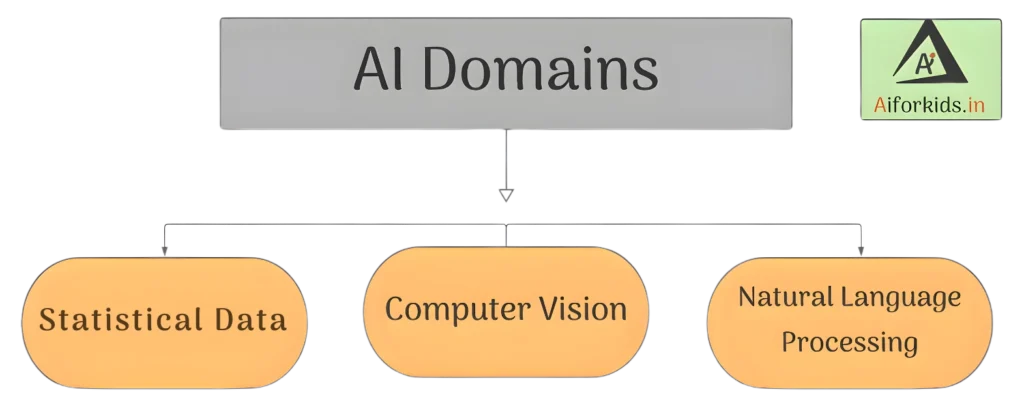
Statistical Data
Statistical Data is an AI domain concerned with handling large amounts of data. In this process, data is collected, stored, and analyzed to identify patterns and extract useful information, which can then be used to make decisions.
Example of Statistical Data

Price Comparison Websites
- Price comparison websites work using large amounts of data collected from multiple sellers.
- These platforms allow users to easily compare the prices of the same product offered by different vendors at a single place, making purchasing decisions simpler and quicker.
- Today, such websites are widely used across various fields, including technology, hospitality, automobiles, consumer durables, and apparel.
Example: Websites such as PriceGrabber, PriceRunner, Junglee, Shopzilla, and DealTime are common examples.
Computer Vision
Computer Vision, commonly known as CV, is a domain of Artificial Intelligence that enables machines to capture, analyse, and interpret visual information in order to make decisions. This process includes acquiring images, processing them, analyzing visual patterns, identifying objects, and extracting useful information.
In computer vision, the input provided to machines may include photographs, videos, and images obtained from various sources such as thermal or infrared sensors.
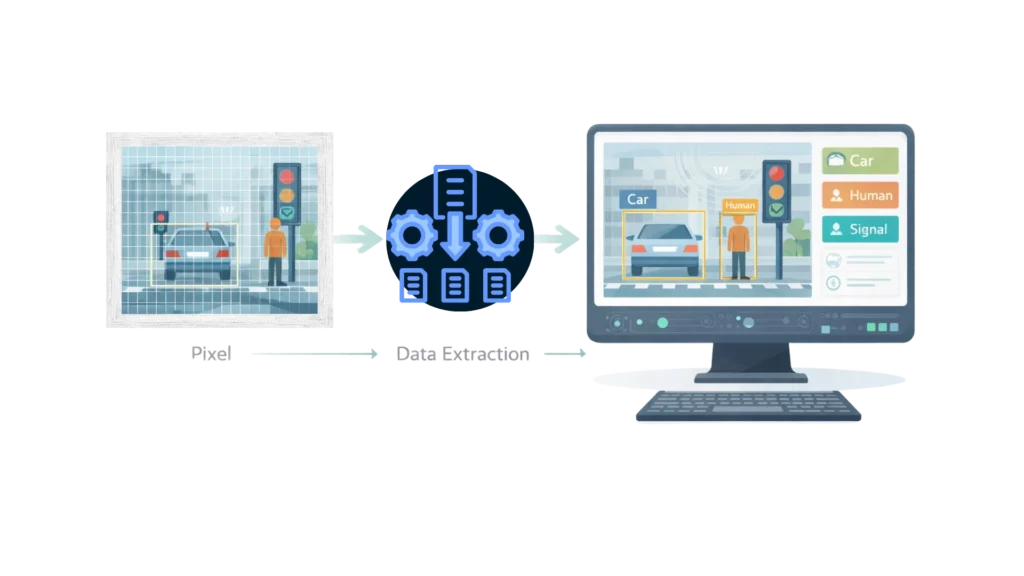
Computer vision projects convert digital visual data into meaningful descriptions, which are then translated into a computer-readable form to support decision-making. The primary goal of this AI domain is to teach machines how to extract and understand information from pixels.
Examples of Computer Vision

- Computer vision is employed in agriculture for crop monitoring, pest detection, and yield estimation. Drones with cameras capture aerial images of farmland, which are then analysed to assess crop health and optimize farming practices.
- Computer vision is used in surveillance systems to monitor public spaces, buildings, and borders. It can detect suspicious activities, track individuals or vehicles, and provide real-time alerts to security personnel.

Natural Language Processing
Natural Language Processing, commonly known as NLP, is a branch of Artificial Intelligence that focuses on enabling computers to communicate and interact with humans using natural language.
- Natural language includes the words and sentences that people speak and write in their daily lives.
- NLP uses algorithms to process, analyze, and extract meaningful information from this spoken and written data.
- The main goal of Natural Language Processing is to help machines read, understand, and interpret human language in a useful and meaningful way.
Examples of NLP

Email filters
Email filters are one of the most basic and initial applications of NLP online. It started with spam filters, uncovering certain words or phrases that signal a spam message.
Machine Translation
NLP is used in machine translation systems like Google Translate and Microsoft Translator to automatically translate text from one language to another.

Ethical Frameworks for AI
Frameworks are a set of steps that help us in solving problems. It provides a step-by-step guide for solving problems in an organized manner.
Frameworks provide a clear and organized way to solve problems by considering all important factors. They also help people communicate better by offering a common approach that encourages consistency and sharing of best practices.
Example: The most common and best example is Project Cycle.
- As anyone who has studied project cycle, would share the common approach leading to consistency
- Using common Framework like Project cycle make it easier for others to correct mistakes and improve efficiency
Ethical Frameworks
These are frameworks which help us ensure that the choices we make do not cause unintended harm.
Ethical frameworks help people handle difficult moral situations by guiding them through ethical principles.
Using these frameworks allows individuals and organizations to make informed decisions that reflect their values and create positive outcomes for everyone involved.
Need for Ethical Frameworks for AI?
- As we have seen how bias could result in unwanted outcomes in AI solutions. Think of a hiring algorithm that showed bias against women applicants.
- AI essentially serves as a decision-making and influencing tool. As such we need to ensure that AI makes morally acceptable recommendations
- Ethical frameworks ensure that AI makes morally acceptable choices. If we use ethical frameworks while building our AI solutions, we can avoid unintended outcomes, even before they take place!
Types of Ethical Frameworks
Ethical frameworks for AI can be categorised into two main types:
- Sector-based Frameworks
- Sector-based frameworks are ethical guidelines designed for specific sectors or industries.
- In Artificial Intelligence, Bioethics is a common sector-based framework that focuses on ethical issues in healthcare, such as patient privacy, data security, and the responsible use of AI in medical decisions.
- Sector-based ethical frameworks are also applied in areas like finance, education, transportation, agriculture, governance, and law enforcement.
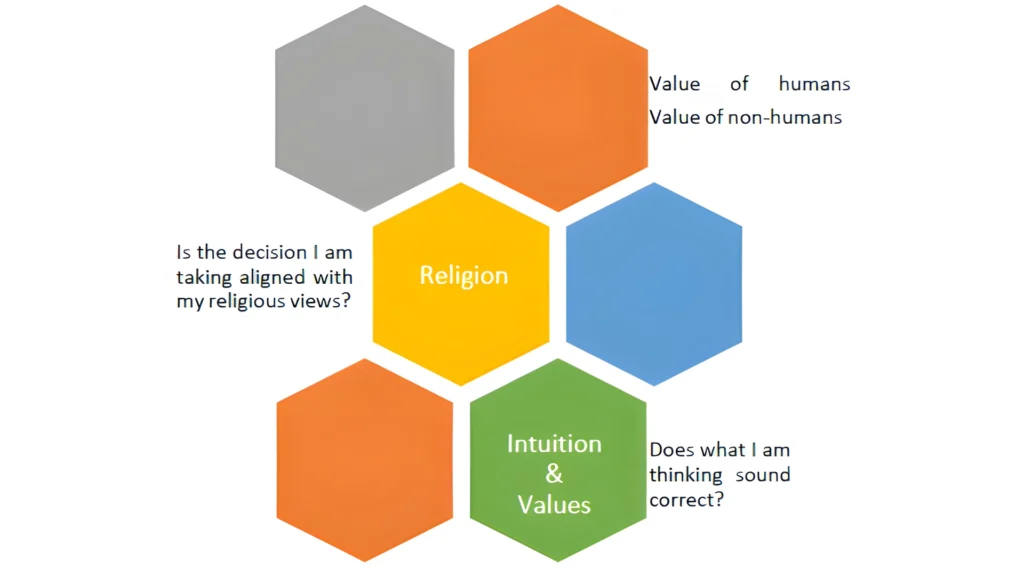
- Value-based Frameworks
- Value-based frameworks focus on core ethical values and principles that guide decision-making.
- These frameworks help evaluate whether an action is morally right or wrong by considering different ethical philosophies and promoting ethical behaviour.
Value-based frameworks are classified into three main types:
- Rights-Based Framework
- This framework emphasizes the protection of human rights and dignity. It prioritizes individual freedom, autonomy, and equality, ensuring that AI systems do not violate human rights or discriminate against any group.
- Utility-Based Framework
- The utility-based framework focuses on achieving the greatest benefit for the largest number of people while minimizing harm. In AI, this involves balancing the advantages of AI solutions with potential risks such as privacy issues or job loss.
- Virtue-Based Framework
- This framework concentrates on the character and intentions of individuals involved in decision-making. It evaluates whether actions align with moral values like honesty, integrity, and compassion throughout the AI development and usage process.
These classifications offer a structured approach to addressing ethical concerns in AI development and deployment. Moreover, they ensure that each sector and its fundamental ethical values receive proper consideration.
Bioethics
Bioethics is an ethical framework used in healthcare and life sciences.
It deals with ethical issues related to health, medicine, and biological sciences, ensuring that AI applications in healthcare adhere to ethical standards and considerations.
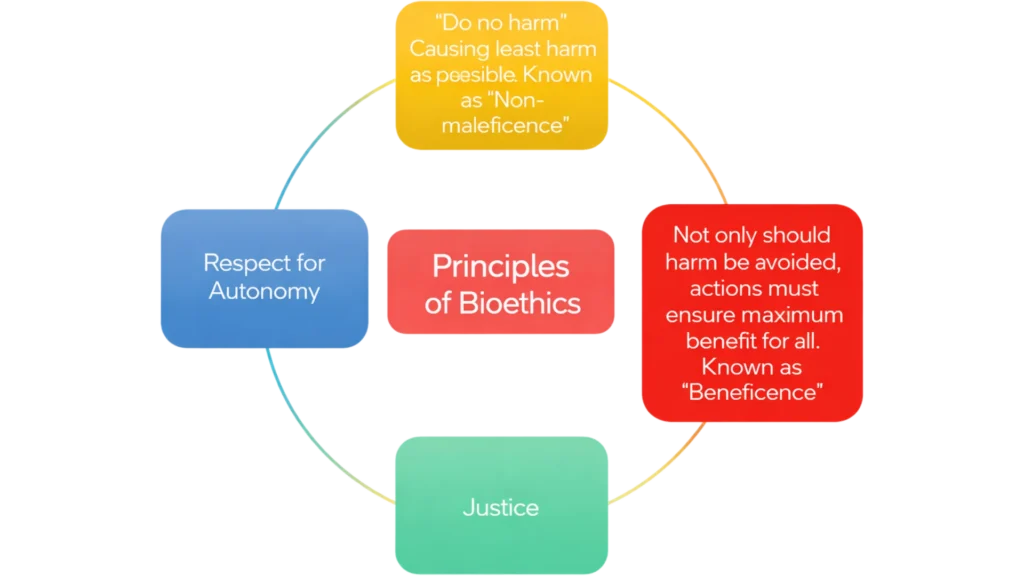
The four principles of bioethics can be used to ensure an ethical AI solution for the healthcare problem:
- Respect for autonomy: Enabling users to be fully aware of decision-making. E.g., users of an AI algorithm should know how it functions.
- Do not harm: Harm to anyone (be it human or non–human) must be avoided at all costs
- Maximum benefit: Not only should we avoid harm our actions must focus on providing the maximum benefit possible
- Justice: All benefits and burdens of a particular choice must be distributed in a justified manner across people irrespective of their background.
Principles of bioethics:
- Respect for Autonomy.
- Do not harm.
- Ensure maximum benefit for all.
- Give justice
Non-maleficence
refers to the ethical principle of avoiding causing harm or negative consequences. It emphasizes the obligation to minimize harm as much as possible and prioritize actions that prevent harm to individuals, communities, or the environment.
Maleficence
refers to the concept of intentionally causing harm or wrongdoing
Beneficence
refers to the ethical principle of promoting and maximizing the well-being and welfare of individuals and society. It emphasizes actions that produce positive outcomes and contribute to the overall good. Moreover, it aims to achieve the greatest benefit for all stakeholders involved.