menu search
brightness_auto
more_vert
2 1

___________ refers to the techniques and tools that are used for identifying important patterns and trends using graphs.

Topic: Data Visualization Class 10  Artificial Intelligence 417

Type:  Fill in the blank

thumb_up_off_alt 2 like thumb_down_off_alt 0 dislike

1 Answer

more_vert
 
verified
Verified Answer
1

Data Visualisation

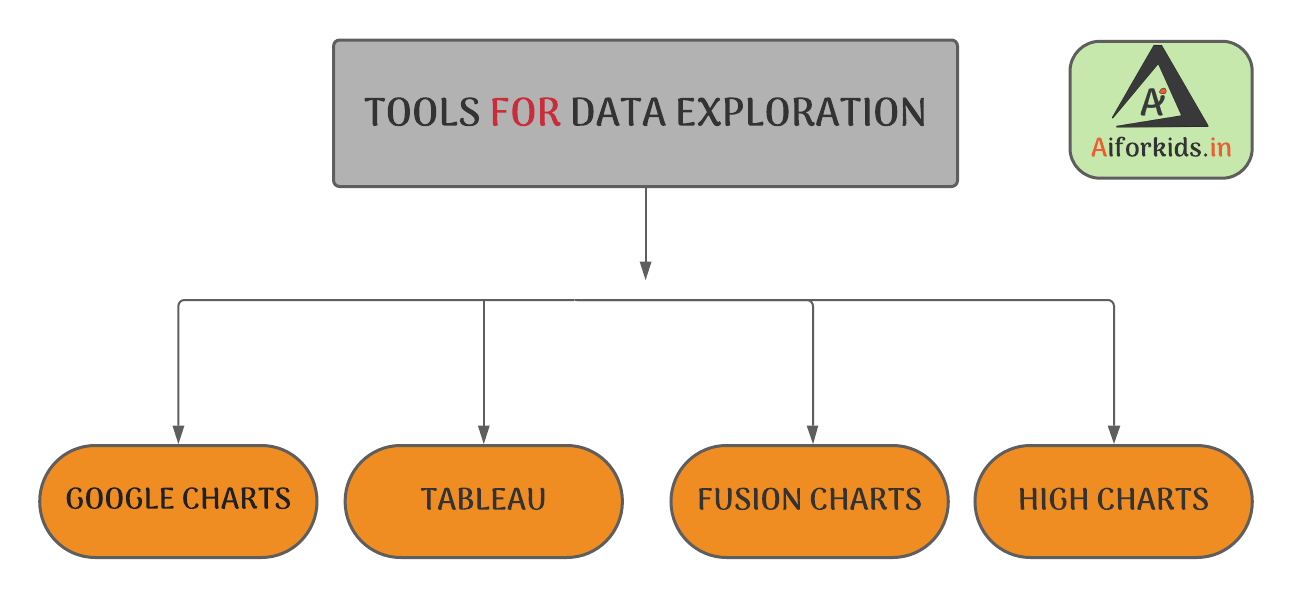
  1. Data Visualisation refers to the techniques and tools that are used for identifying important patterns and trends using graphs.

 Explanation:-

  1. Data Exploration or Data Visualisation is the process of arranging the gathered data uniformly for a better understanding. Data can be arranged in the form of a table, plotting a chart, or making a database.
  2. In the process of data exploration, we can make a chart for that data in which all the names will be at one place and all the mobile numbers at one, etc.
  3. Data Exploration Tools Project Cycle

    Learn more about Data Exploration or Data Visualisation on Class 10 Data Visualisation 

thumb_up_off_alt 1 like thumb_down_off_alt 0 dislike

Related questions

thumb_up_off_alt 2 like thumb_down_off_alt 0 dislike
1 answer
thumb_up_off_alt 2 like thumb_down_off_alt 0 dislike
1 answer
thumb_up_off_alt 2 like thumb_down_off_alt 0 dislike
1 answer
thumb_up_off_alt 3 like thumb_down_off_alt 0 dislike
1 answer
thumb_up_off_alt 2 like thumb_down_off_alt 0 dislike
1 answer
thumb_up_off_alt 2 like thumb_down_off_alt 0 dislike
1 answer
thumb_up_off_alt 3 like thumb_down_off_alt 0 dislike
1 answer
thumb_up_off_alt 2 like thumb_down_off_alt 0 dislike
1 answer
Welcome to Aiforkids, where you can ask questions and receive answers from other members of the community.

AI 2024 Class 10 Board Exams mein 100% laane ka plan OPEN NOW

Class 10 Complete One Shot AI Lectures at - Youtube
...