Project Cycle Glossary Class 9
Project Cycle Overview
What is Project Cycle ?
In earlier classes we have studied about Water Cycle, etc. In water Cycle we studied that how is the journey of water carried out from one step to other till the end.
Like that in Project Cycle we are going to deal with the steps involved in creating a project, starting from the given problem till the project is created and tested.
Project Cycle is a step by step process to solve the problems using proven scientific methods and drawing the inference about it.
Making Tea
- Boil Water .
- Put Tea Powder
- Put Milk
Creating a birthday card.
- Checking the factors like budget,etc Which will help us decide the next steps and understanding the Project.
- Acquiring data from different sources like online, with friends etc for Designs and ideas.
- Making a list of the gathered data.
- Creating or Modelling a card on the basis of the data collected.
- Showing it to Parents or cousins to Let them check it or evaluate it.
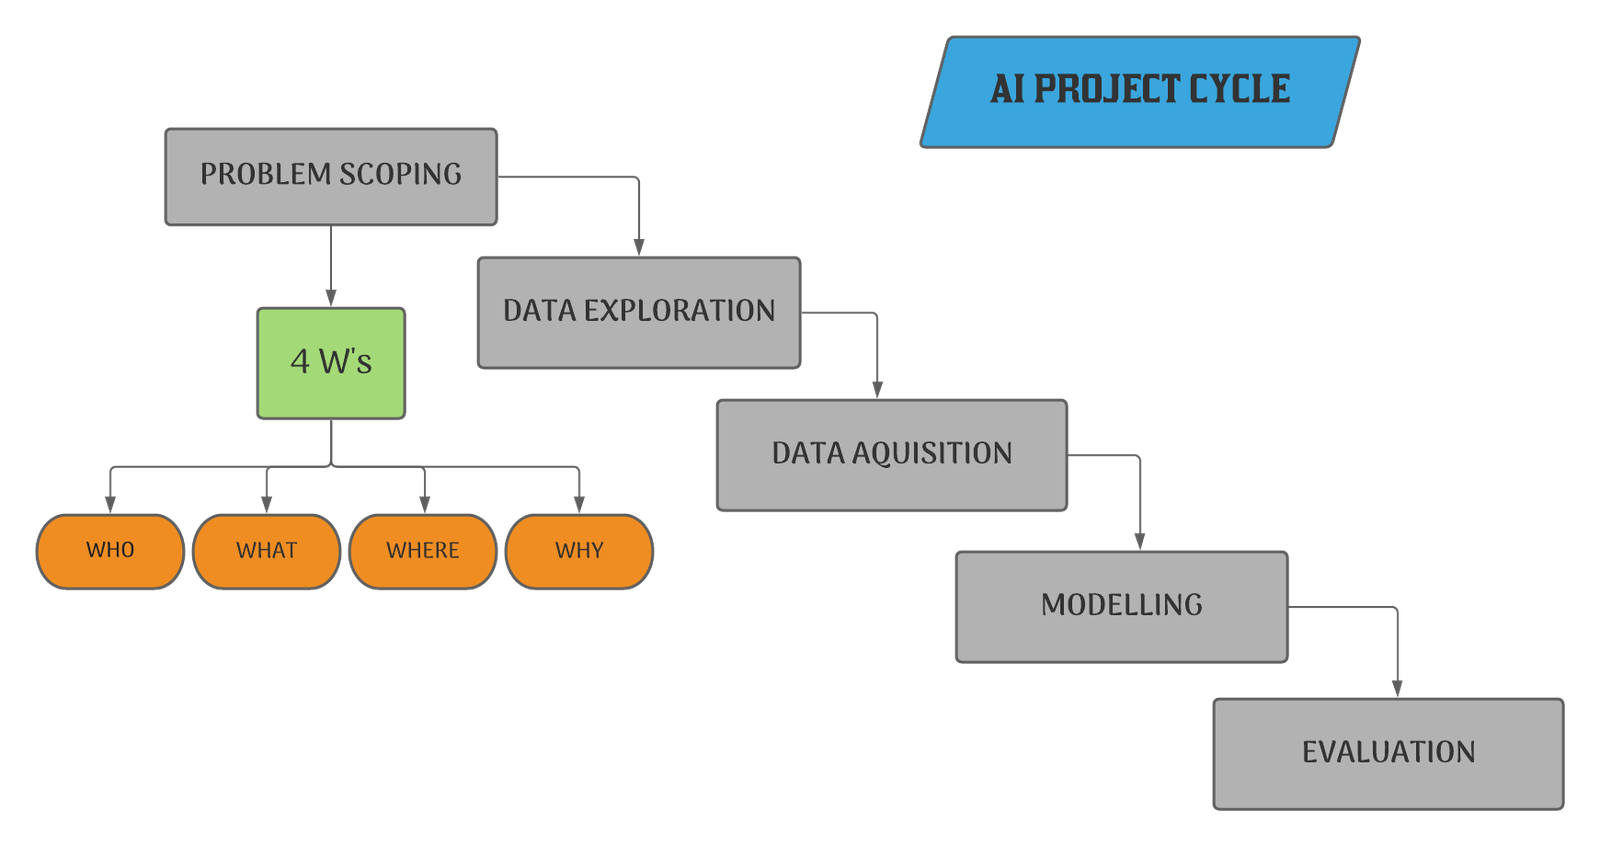
Components of Project Cycle
Components of project cycle are the steps which contributes in completing the Project.
| Problem Scoping | Understanding the problem |
| Data Acquisition | Collecting accurate and reliable data |
| Data Exploration | Arranging the data uniformly |
| Modelling | Creating Models from the data |
| Evaluation | Evaluating the project |
Problem Scoping
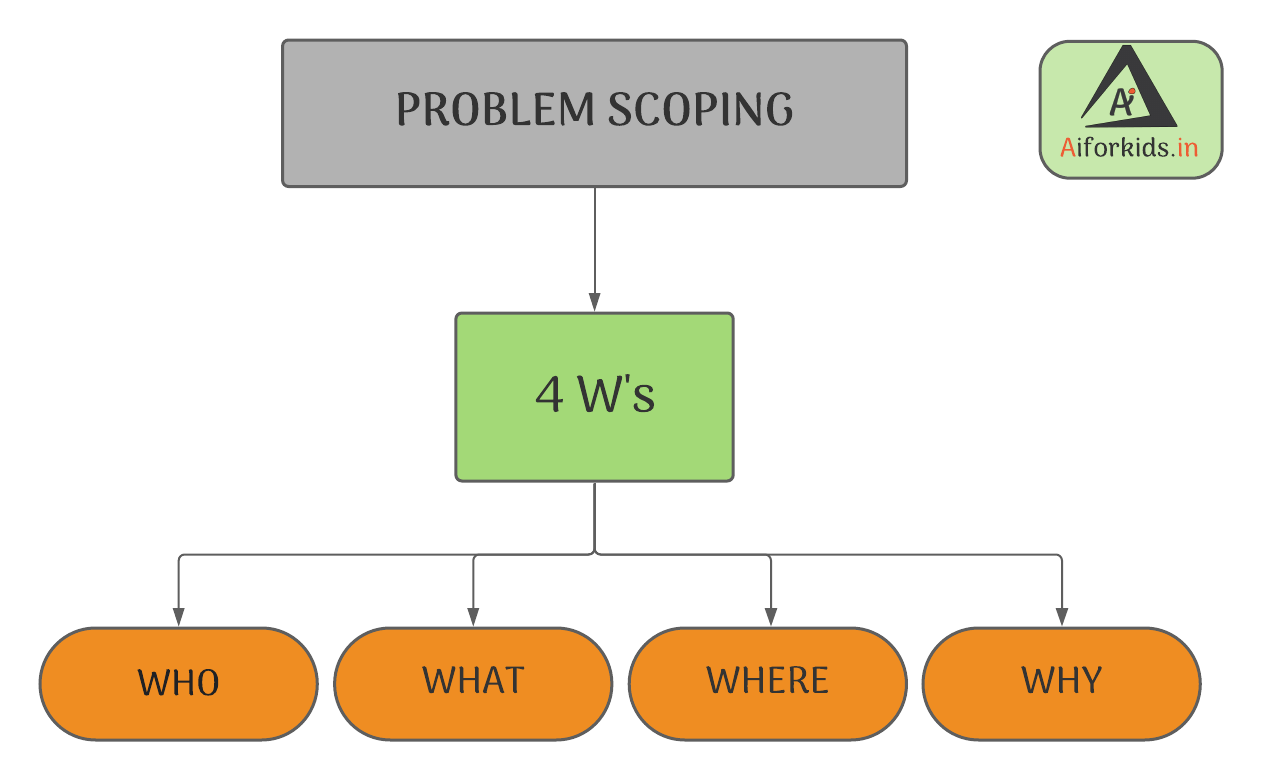
Problem Scoping refers to understanding a problem finding out various factors which affect the problem, define the goal or aim of the project.
4Ws Of Problem Scoping
The 4W's of Problem Scoping are Who, What, Where and Why. These Ws helps in identifying and understanding the problem in a better and efficient manner.
1. Who - "Who" part helps us in comprehending and categorizing who all are affected directly and indirectly with the problem and who are called the Stake Holders
2. What - "What" part helps us in understanding and identifying the nature of the problem and under this block, you also gather evidence to prove that the problem you have selected actually exists.
3. Where - "Where" does the problem arises, situation and the location.
4. Why - "Why" is the given problem worth solving.
Problem Statement Template
The
Problem Statement Template helps us to summarise all the key points into one
single.
Template so
that in future, whenever there is need to look back at the basis of the problem, we can take a look at
the Problem Statement Template and understand the key elements of it.
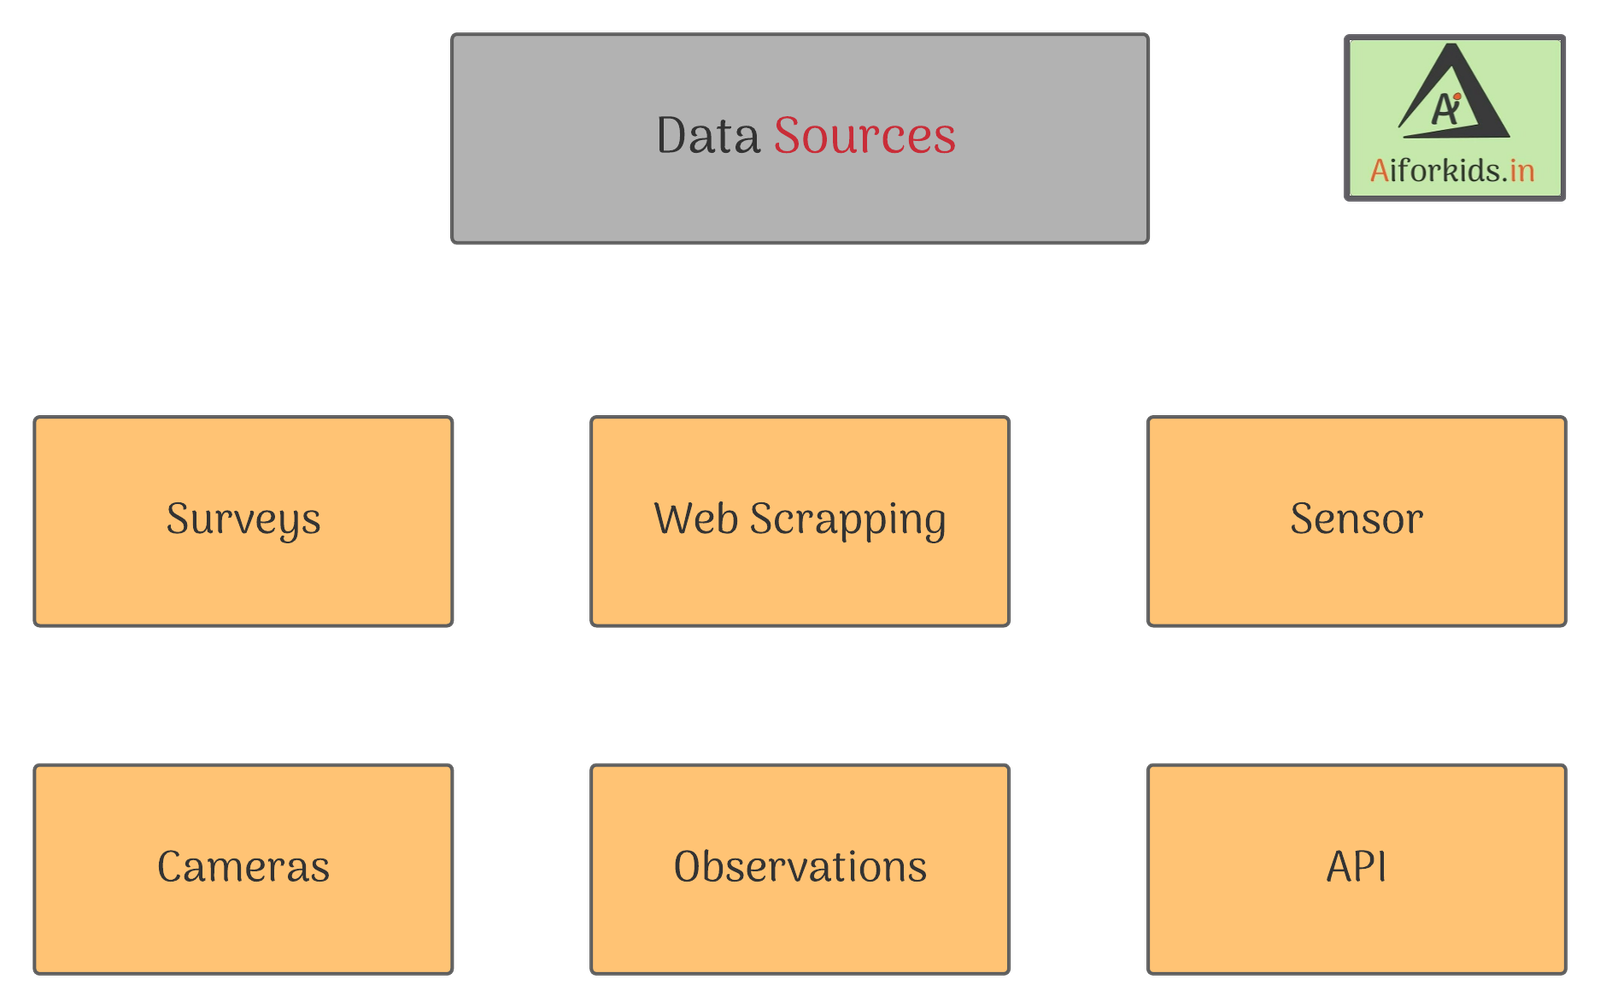
Data Acquisition
Data Acquisition is he process of collecting accurate and reliable data to work with. Data Can be in the format of text, video, images, audio and so on and it can be collected from carious source like the interest, journals, newspapers and so on.
Data Sources
Data Exploration
Data Exploration is the process of arranging the gathered data uniformly for a better understanding. Data can be arranged in the form of a table, plotting a chart or making database.
If we simplify this Data Exploration means that the data which we collected in Data
Acquisition, in Data Exploration we need to arrange it for example if we have data of 50 students in a
class, we have their Mobile Number, Date of Birth, Class, Etc .
In the process of data
exploration we can make a chart for that data in which all the names will be at one place and all the
mobile numbers at one etc.
Data Exploration or Visualization Tools
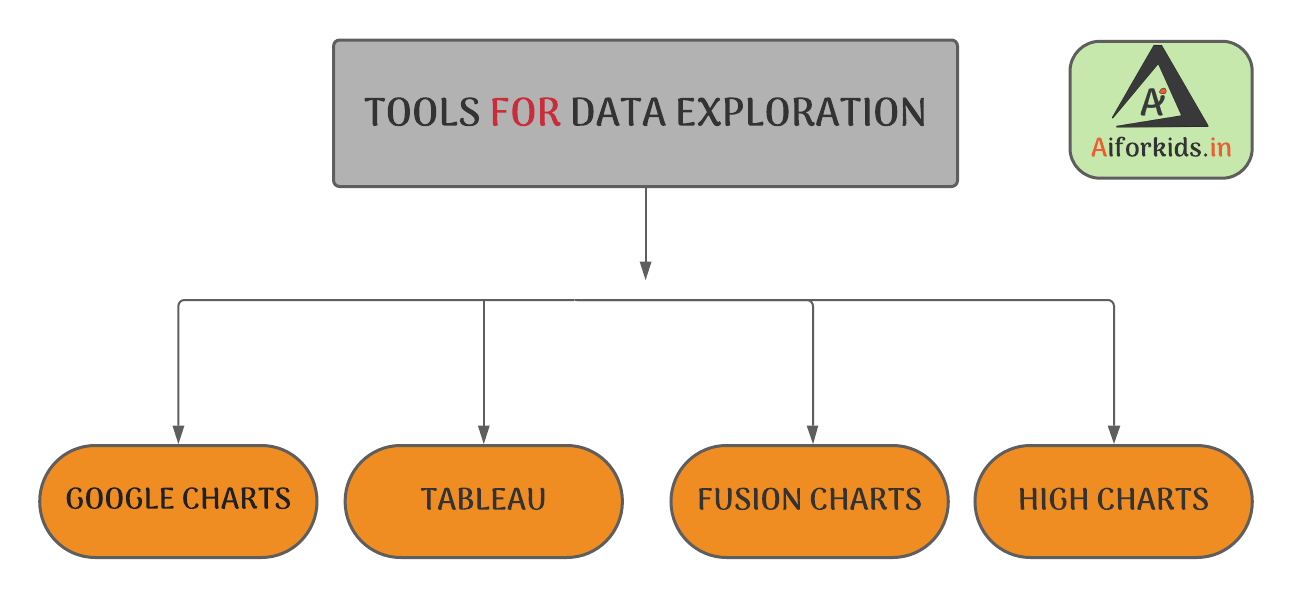
1. Google Charts
Google chart tools are powerful, simple to use, and free. Try out our rich gallery of interactive charts and data tools.
2. Tableau
Tableau is often regarded as the grand master of data visualization software and for good reason.
Tableau has a very large customer base of 57,000+ accounts across many industries due to its
simplicity of use and ability to produce interactive visualizations far beyond those provided by general
BI solutions.
3. FusionCharts
This is a very widely-used, JavaScript-based charting and visualization package that has established itself as one of the leaders in the paid-for market.
It can produce 90 different chart types and integrates with a large number of platforms and frameworks giving a great deal of flexibility.
4. Highcharts
A simple options-structure allows for deep customization, and styling can be done via JavaScript or CSS. Highcharts is also extendable and pluggable for experts seeking advanced animations and functionality.
Modelling
Modelling is the process in which different models based on the visualized data can be created and even checked for the advantages and disadvantages of the model.
To Make a machine learning model there are 2 ways/Approaches Learning Based Approach and Rule Based Approach
Learning Based Approach
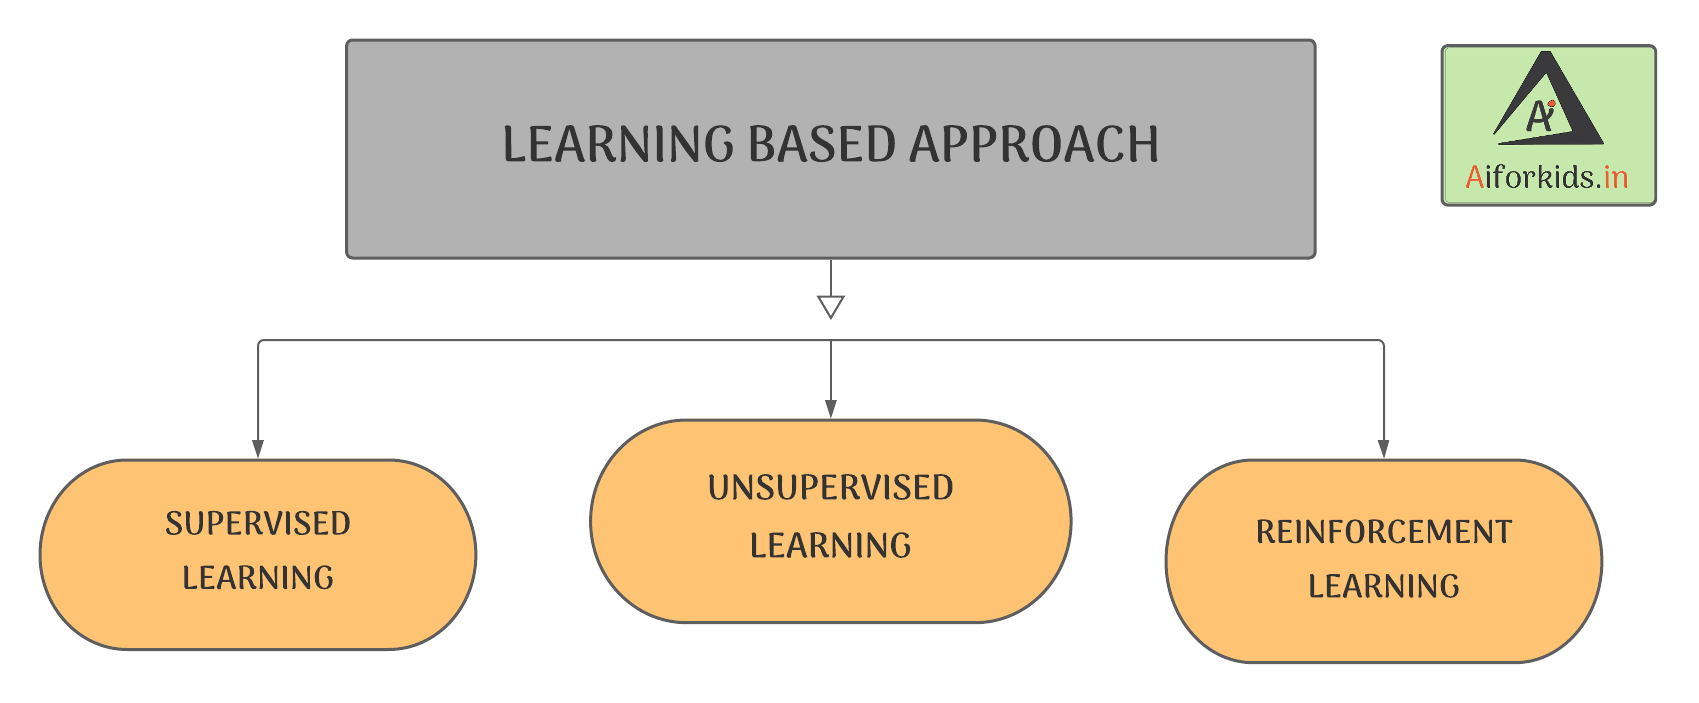
Learning Based Approach is based on Machine learning experiance with the data feeded.
Machine Learning
Machine learning is a subset of artificial Intelligence (AI) whcih provides machines the ability to learn automatically and improve from experience without being programmed for it.
Types of Machine Learning
Machine learning can be divided into 3 types, Supervised Learning, Unsupervised Learning, andSemisupervised or Reinforcement Learning
Supervised Learning
Unsupervised Learning
Reinforcement Learning
Rule Based Approach
Datasets
Dataset is a collection of related sets of Information that is composed of separate elements but can be manipulated by a computer as a unit.
In Rule based Approach we will deal with 2 divisions of dataset:
1. Training Data - A subset required to train the model
2. Testing Data - A subset required while testing the trained the
model
Training Set
Testing Set
| Base | Training Set | Testing Set |
| Use | Used for Training the Model | Used for Testing the Model after it is trained |
| Size | Is allot bigger than testing data and constitutes about 70% to 80% | It is smaller than Training Set and constitutes about 20% to 30% |
Evaluation
Evaluation is the method of understanding the reliability of an API Evaluation and is based on the outputs which is received by the feeding the data into the model and comparing the output with the actual answers.
API Stands for Application Programming Interface
Important Links
| Class 9 Syllabus | Class 9 Worksheets |
| Class 9 Projects | Class 9 Quizzes |